Coffee and tea are two beverages that are truly loved by many people around the world. The daily bugdet spent, for the average person, to buy a cup of tea or coffee is usually very low, in every country. So, how much profit is made, yearly, for those products?
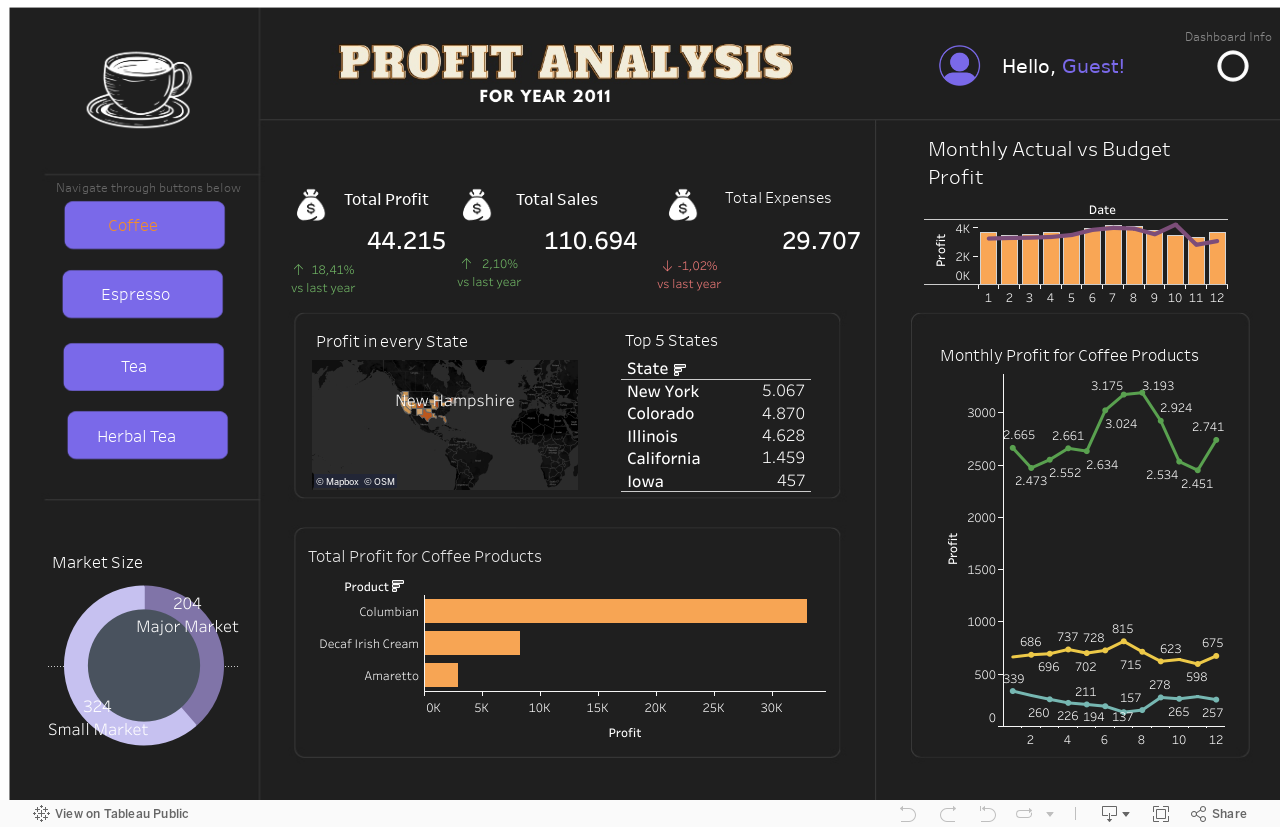
The dataset that is used in this project contains information about sales values in dollars on American Stores between 2010 and 2011. The informations are about different types of Coffee (Columbian, Decaf Irish Cream and Amaretto), Espresso (Decaf Espresso, Caffe Mocha, Caffe Latte and Regular Espresso), Tea (Darjeeling, Earl Grey and Green Tea) and Herbal Tea (Lemon, Chamomile and Mint). Let’s check how well those products perform in USA.